Evaluation of Global Horizontal Irradiance Derived from CLAVR-x Model and COMS Imagery Over the Korean Peninsula
Copyright © 2016 by the New & Renewable Energy
This is an Open Access article distributed under the terms of the Creative Commons Attribution Non-Commercial License (http://creativecommons.org/licenses/by-nc/3.0) which permits unrestricted non-commercial use, distribution, and reproduction in any medium, provided the original work is properly cited.
Abstract
Satellite-derived solar irradiance was evaluated against four ground observations for clear and cloudy skies. The solar irradiance estimated by the CLAVR-x model was positively biased for clear sky and the error metrics increased when clouds exist. The COMS operational products include the solar insolation, which is underestimated when comparing with the clear sky solar irradiance measured at ground stations. The biases for clear sky were correlated with the solar zenith angle and therefore correction factor was formulated as a function of the cosine of the solar zenith angle. After the correction, the solar irradiance estimates were consistent with the observed solar irradiance. For cloudy sky, the CLAVR-x model failed to detect the cloudy pixel for shallow clouds.
Keywords:
Satellite, Global Horizontal Irradiance, CLAVR-x model, COMS1. Introduction
Solar power generation plays a substantial role as a clean energy all over the world.[1] Solar resource assessment has to be made before building solar power plant. Although the in situ measurements at the ground stations are the best way to assess solar resource, there is still limitation for employing ground observations because of spatial distribution. Satellite imagery is a good alternative to avoid the spatial limitation. Geostationary satellite can be monitoring the atmospheric state and cloud cover for all day and on spatial resolution up to several hundred meters.[2,3]
There have been several studies to derive the solar irradiance from the satellite based on statistical and physical models.[4,5,6,7] For example, Kim et al.[7] developed the University of Arizona Solar Irradiance Based on Satellite (UASIBS) model to derive the solar irradiance over Southwestern U.S. including Arizona, Nevada and California by using Geostationary Operational Environmental Satellite-15 (GOES-15) products and look-up tables that are precompiled by radiative transfer model. They found that the UASIBS estimates are well-consistent with solar irradiance observed at three ground stations.
In Korea, several attempts have been made to derive solar irradiance from satellite imagery since Communication, Ocean and Meteorology Satellite (COMS) was launched at 128.2 oE in longitude in 2011.[8,9,10] The Korea Meteorological Administration (KMA) generates the solar irradiance as operational products every fifteen minute. In addition, Cooperative Institute for Meteorological Satellite Studies at the University of Wisconsin Madison collects COMS data and then produces the solar irradiance over East Asia as a project of the Clouds from AVHRR Extended System (CLAVR-x). This study aims at evaluating solar irradiance estimates from CLAVR-x model and COMS products against in situ measurements at the ground stations. Section 2 introduces the data employed in this study. Results are given in Section 3 and then discussed in following section. Section 5 is conclusion.
2. Data
2.1 Ground Observation
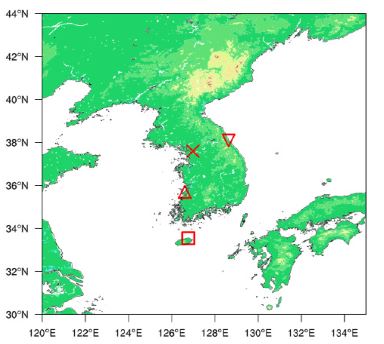
Four ground observation stations provide Global Horizontal Irradiance (GHI) measured every minute. These include the Korea Institute of Energy Research ground stations located at Seoul, Jeju, Buan and Yangyang (Fig. 1). GHI at these stations is measured using Kipp & Zonen Model CMP22, Kipp & Zonen Model CM3 and Precision Spectral pyranometers, respectively.
2.2 CLAVR-x model
The CLAVR-x model ingests the COMS Level-1B data and then produces the cloud microphysical parameters as well as GHI by using physical algorithms with ancillary data for 4 × 4 km2 grid cell. The detailed characteristics of CLAVR-x model are given in Heidinger et al.[11] and therefore we introduce the main algorithm briefly. The first step is to detect the cloudy pixel by Heidinger et al.[12] that employs twelve Bayesian classifiers computed for seven separate surface types. Then, cloudy pixel is classified into one of eight categories based on major findings from Pavolonis et al.[13]’s study; 1-fog, 2-liquid water cloud, 3-supercooled water cloud, 4-mixed 5-opaque ice, 6-cirrus, 7-multilayer cirrus and 8-deep cumulus. After classification of cloudy pixel, cloud optical depth and effective radius are retrieved for daytime observations by an optical estimation approach using the 0.63 and 3.75 μm channels.[14] Final step is to derive GHI by using the retrieved cloud optical depth and effective radius. The current version of CLAVR-x model with COMS Level-1B data does not take into account aerosol optical depth in retrieving GHI. This study collected CLAVR-x estimates every hour during daytime hours (0900 –1800 LST = UTC + 9) from January 1 to February 29, 2016 for the analysis.
2.3 COMS-INS
KMA generates the GHI as an operational product every fifteen minute. This study names the GHI produced by KMA as COMS-INS. The COMS-INS is derived by using Kawamura Model,[15] which is optimized for East Asia.[16] After cloud masking, GHI is calculated for clear and cloudy sky, separately. Ozone and water vapor mixing ratio are major contributors to Rayleigh scattering. COMS-INS employs the OMI ozone global daily input and Total Precipitable Water product from COMS Level-2 for ozone and water vapor mixing ratio, respectively. When deriving GHI for cloudy sky, the incoming solar irradiance is reduced by the scattering and absorption due to cloud drops. Kawai and Kawamura[17] provides the look-up table for extinction coefficient of solar irradiance with respect to cloud albedo and brightness temperature. For 4 × 4 km2 grid cell, COMS-INS data collected every fifteen minute are used to evaluate against ground observation during daytime hours (0900 –1800 LST) from January 1 to February 29, 2016.
3. Results
The error metrics are calculated for the objective evalution; MBE, rMBE, RMSE and rRMSE, which are defined by Eq. 1–Eq. 4, respectively.
| (1) |
| (2) |
| (3) |
| (4) |
where N is number of samples, and E and O indicate the estimate and observation, respectively.
3.1 Evaluation of CLAVR-x model
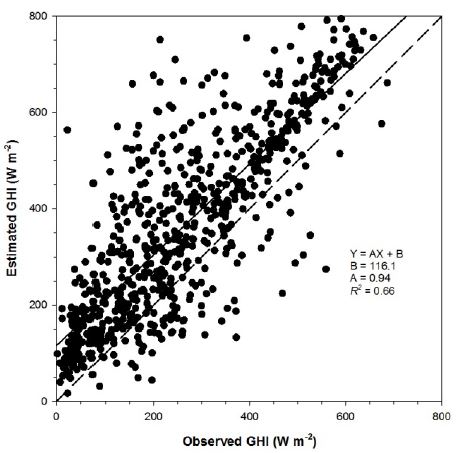
For the purpose of comparing instantaneous GHI estimated by the CLAVR-x model to ground observations with 1 minute resolution, we averaged ground observations over 10 minute intervals centered on the acquisition time of the COMS Meteorological Imager because sensor usually takes 30 minutes to scan the whole disk of the Earth. In addition, GHI estimated from the CLAVR-x model is evaluated for clear and cloudy skies separately because GHI errors under clear sky are much lower than errors for cloudy sky. In classifying estimates, we employ clear sky index, which is defined as ratio of GHI estimates to those as clear sky. All estimates is divided into clear sky when clear sky index is higher than 0.9. Otherwise, a pixel is set as being cloudy sky. During investigation period, there are 966, 237 and 719 estimates for all, clear and cloudy sky, respectively.
Figure 2 shows scatter plot of the CLAVR-x GHI estimates against the observed at all stations for clear sky. Correlation coefficient (R2) is given in Fig. 2 together with slope and intercept of linear regression line. R2 is 0.79, which is relatively lower because of the negatively biased outliers. These negative biases might be due to small clouds that cannot be resolved at current horizontal resolution of 4 km. Without outliers, all estimates are positively biased and the magnitude increases with the observed GHI as well. This might be because aerosol optical depth is not considered in the current version of CLAVR-x model. Table 1 lists the MBE, rMBE, RMSE and rRMSE for clear sky. The CLAVR-x model overestimates the GHI: MBE and rMBE are 37.5 W m−2 and 7.5%, respectively. RMSE is 65.1 W m−2 and then normalized to the observation as 13.1%. All estimates are illustrated against the observed GHI for cloudy sky in Fig. 3. The correlation coefficient is lower, comparing with that for clear sky. When looking at the error metrics for cloudy sky, MBE and RMSE are larger than those for clear sky; 101.0 W m−2 for MBE and 149.8 W m−2 for RMSE (Table 1). MBE and RMSE increased for cloudy sky indicate that there is still limitation for estimating cloud optical properties in the current version of CLAVR-x model. All skies combining clear and cloudy skies yields that the normalized RMSE is 41.9%.
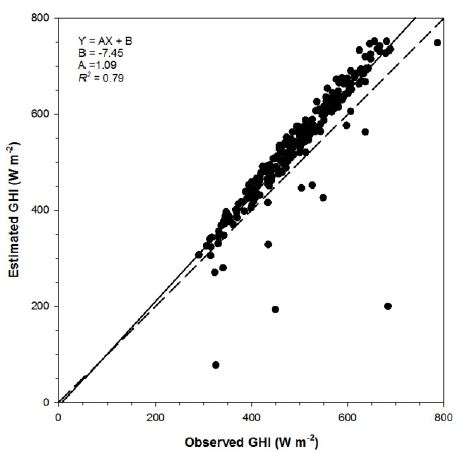
Scatter plot of estimated GHI from CLAVR-x model with observed GHI for clear sky. Correlation coefficient, and slope and intercept of linear regression line are given in the plot. Dashed line indicates the reference line.
3.2 Evaluation of COMS-INS
Evaluation is done in same way as CLAVR-x model: ground observations are averaged over 10 minute intervals centered on the acquisition time of the COMS Meteorological Imager. All, clear and cloudy sky are 1886, 565, 1321, respectively, from January to February, 2016. Figure 4 shows that all estimations are negatively biased with outliers for clear skies. R2 is 0.74 and the slope of linear regression line is 0.62, which indicates that rMBE is −34% (Table 2). When comparing with CLAVR-x model, rRMSE is much smaller in COMS-INS (13.1% vs. 36%).
Figure 5 is the scatter plot of GHI between COMS-INS estimation and observation when a pixel is classified as being cloudy sky. The COMS-INS overestimates the smaller GHI than 100 W m−2 but opposite is true for larger GHI than 100 W m−2, which means that cloud optical depth is overestimated for relatively shallow clouds. Baek et al.[18] presented similar error metrics: the COMS-INS estimates are smaller than the observed GHI at two flux towers during the investigation period from April 1 to October 31, 2011. Table 2 lists that the normalized RMSE is 42.1% for cloudy sky, which is lower than CLAVR-x model.
4. Discussion
As shown in Fig. 2, magnitude in bias is proportional to the observed GHI without outliers, which makes bias corrected by using cosine of solar zenith angle. Figure 6 is the bias as a function of cosine of solar zenith angle. Correlation coefficient is too small to build the correction factor. To facilitate the bias correction with respect to solar zenith angle, we average the biases over bin of cosine of solar zenith angle. The size of each bin is determined as 0.1 from 0.3; 0.3 –0.4, 0.4 –0.5, 0.5 –0.6, 0.6 –0.7. MBE for each bin is highly correlated with cosine of solar zenith angle and therefore it is enough to build the correction factor. With correction equation given inFig. 6, GHI estimates will be corrected as follows:
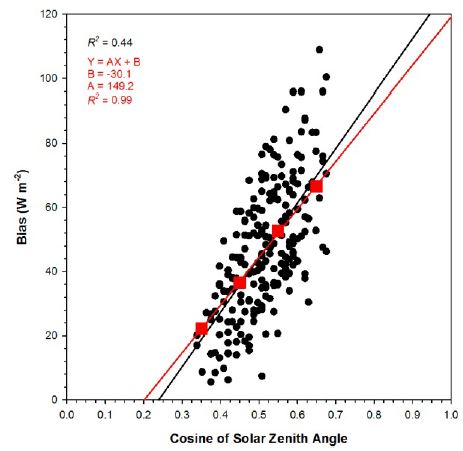
Scatter plot of GHI biases and averaged GHI biases for bin of cosine of solar zenith angle from CLAVR-X model. Correlation coefficient and regression formula from averaged GHI bias are given as red color in the plot.
| (5) |
| (6) |
where SZA is solar zenith angle.
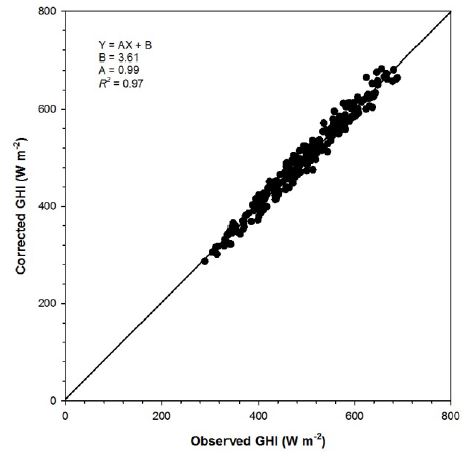
The corrected GHI estimations from CLAVR-x model is well-consistent with the in situ measurement on the ground for clear sky after correction (Fig. 7). Correlation coefficient, rMBE and rRMSE are 0.97, 0.15% and 3.1%, respectively.
COMS-INS GHI estimations would be improved in same way as CLAVR-x model estimates by using a single correction factor. Figure 8 shows the negative correlation between biases and solar zenith angle with large standard deviation, which implies that it is difficult to find the correction factor. For the sake of simplification, biases are averaged in similar manner to CLAVR-x model did. Contrary to CLAVR-x model, there is non-linear relationship between two variables, bias and cosine of solar zenith angle (Fig. 8). Through curve-fitting procedure, we yield correction equation as an exponential function with high correlation coefficient (0.99). As shown in Fig. 9, correcting biases makes it possible for COMS-INS estimates to be highly correlated with the observed GHI (R2=0.90). rMBE and rRMSE values are reduced to 0.13 and 7.1%, respectively.
A detailed analysis is made for all skies in Fig. 10, which is the MBE for each cloud classification from CLAVR-x model together with clear sky index. Both MBE and clear sky index are higher for clear sky and probable clear sky, which means that cloud detection procedure in CLAVR-x model fails to capture cloud when shallow clouds exist and therefore GHI is derived for clear sky conditions. It is interesting to see MBE for deep cumulus clouds. Although clear sky index is the smallest for this class, MBE is larger than 90 W m−2. This makes sense since cloud optical depth is underestimated.
5. Conclusion
Evaluation of GHI estimates from CLAVR-x model and COMS-INS was made against four ground observation. CLAVR-x model and COMS-INS employ the COMS Level-1B as input and then derive the GHI by using physical algorithm. In the evaluation, we divided the GHI estimates into clear and cloudy sky by using clear sky index. CLAVR-x model overestimated the GHI for clear sky but opposite is true for COMS-INS product. The magnitude in bias is proportional to the observed GHI and therefore correction factor was generated as a function of cosine of solar zenith angle. After correcting the estimates, CLAVR-x model and COMS-INS reduce the MBE and RMSE. When comparing with the observed GHI for cloudy sky, rRMSE is larger than 40% for two estimates. In the CLAVR-x model, a pixel over which shallow exist appears to be classified into clear pixel and therefore MBE is the largest among all cloud classes. The correction factors were derived from limited datasets but the algorithm for correcting biases will be extended to the other season.
Nomenclature
| N : | number of samples |
| E : | estimate |
| O : | observation |
| R2 : | correlation coefficient |
Acknowledgments
This work was conducted under framework of the research and development program of the Korea Institute of Energy Research (B6-2427).
References
- NREL, (2012), “U.S. Department of Energy Workshop Report: Solar Resources and Forecasting”, Technical Report No. NREL/TP-5500-55432.
-
Zelenka, A., Perez, R., Seals, R., Renné, D., (1999), “Effective Accuracy of Satellite-Derived Hourly Irradiances”, Theor. and Appl. Climato, 62(3-4), p199-207.
[https://doi.org/10.1007/s007040050084]

-
Vignola, F., Harlan, P., Perez, R., Kmiecik, M., (2007), “Analysis of satellite derived beam and global solar radiation data”, Solar Energy, 81(6), p768-772.
[https://doi.org/10.1016/j.solener.2006.10.003]

-
Gautier, C., Diak, G., Masse, S., (1980), “A Simple Physical Model to Estimate Incident Solar Radiation at the Surface from GOES Satellite Data”, J. Appl. Meteor, 19, p1005-1012.
[https://doi.org/10.1175/1520-0450(1980)019<1005:ASPMTE>2.0.CO;2]

- Raphael, C., Hay, J. E., (1984), “An Assessment of Models which use Satellite Data to Estimate Solar Irradiance at the Earth’s Surface”, J. of Climat. and Appl., Meteor, 23, p832-844.
-
Perez, R., Ineichen, P., Moore, K., Kmiecik, M., Chain, C., George, R., Vignola, F., (2002), “A new operational model for satellite-derived irradiances: description and validation”, Solar Energy, 73(5), p307-317.
[https://doi.org/10.1016/S0038-092X(02)00122-6]

-
Kim, C. K., Holmgren, W. F., Stovern, M., Betterton, E. A., (2016), “Toward Improved Solar Irradiance Forecasts: Derivation of Downwelling Surface Shortwave Radiation in Arizona from Satellite”, Pure Appl. Geophys, 173, p2535-2553.
[https://doi.org/10.1007/s00024-016-1302-3]

-
Jee, J.-B., Zo, I.-S., Lee, K.-T., (2013), “A study on the Retrievals of Downward Solar Radiation at the Surface based on the Observations from Multiple Geostationary Satellites”, Korean J. of Remote Sensing, 29(1), p123-135.
[https://doi.org/10.7780/kjrs.2013.29.1.12]

-
Lee, J., Choi, W. S., Kim, Y. I., Yun, C., Jo, D., Kang, Y., (2013), “Estimation of Global Horizontal Insolation over the Korean Peninsula Based on COMS MI Satellite Images”, Korean J. of Remote Sensing, 29(1), p151-160.
[https://doi.org/10.7780/kjrs.2013.29.1.14]

- Choi, W. S., Song, A. R., Kim, Y. I., (2015), “Solar Irradiance Estimation in Korea by Using Modified Heliosat-II Method and COMS-MI Imagery”, J. of the Korean Soc. Of Surveying, Geodesy, Photo. And Carto, 33(5), p463-472.
- Heidinger, A., Walther, A., Botambekov, D., Straka III, W., Wansong, S., (2014), “The Clouds from AVHRR Extended User’s Guide”, CIMMS, University of Wisconsin Madison.
-
Heidinger, A. K., Evan, A. T., Foster, M. J., Walther, A., (2012), “A Naive Bayesian Cloud-Detection Scheme Derived from CALIPSO and Applied within PATMOS-x”, J. Appl. Meteor. and Climat, 51(6), p1129-1144.
[https://doi.org/10.1175/JAMC-D-11-02.1]

-
Pavolonis, M. J., Heidinger, A. K., Uttal, T., (2005), “Daytime Global Cloud Typing from AVHRR and VIIRS: Algorithm Description, Validation, and Comparisons”, J. Appl. Meteor, 44(6), p804-826.
[https://doi.org/10.1175/JAM2236.1]

-
Walther, A., Heidinger, A. K., (2012), “Implementation of the Daytime Cloud Optical and Microphysical Properties Algorithm (DCOMP) in PATMOS-x”, J. Appl. Meteor. and Climat, 51(7), p1371-1390.
[https://doi.org/10.1175/JAMC-D-11-0108.1]

-
Kawamura, H., Tanahashi, S., Takahashi, T., (1998), “Estimation of insolation over the Pacific Ocean off the Sanriku coast”, J. of Ocean, 54(5), p457-464.
[https://doi.org/10.1007/BF02742448]

- National Institute of Meteorological Research, (2007), “Development of Meteorological Data Processing System of Communication, Ocean and Meteorological Satellite”, Korea Meteorological Administration.
-
Kawai, Y., Kawamura, H., (2005), “Validation and Improvement of Satellite-Derived Surface Solar Radiation over the Northwestern Pacific Ocean”, J. of Ocean, 61(1), p79-89.
[https://doi.org/10.1007/s10872-005-0021-7]

-
Baek, J., Byun, K., Kim, D., Choi, M., (2013), “Assessment of Solar Insolation from COMS: Sulma and Cheongmi Watersheds”, Korean J. of Remote Sensing, 29(1), p137-150.
[https://doi.org/10.7780/kjrs.2013.29.1.13]

